Less is more
Graphics designers often fall into the trap of trying to show too much information. Sometimes, showing less information can make for better stories and communication.


Neither my wife nor I watch basketball regularly, though she used to play the sport competitively while in college. As I’d written on my blog a long time ago, I find the NBA hard to watch because of its long and unpredictable ad breaks.
However, a few years back, during one of those seasons when the Golden State Warriors won (or almost won), we got into a debate on “how basketball should be played”. I told her that I loved how Curry had exploited his ability to land long shots to hit loads of three pointers, and it was a very interesting tactical evolution (I’ve also written about some game theory behind three pointers). She countered that this “wasn’t the way to play basketball”, and that my obsession with shooting and long shots came because I had never played the game competitively.
The argument continued..
Wait, this is supposed to be a visualisations newsletter, so why am I talking about basketball and Steph Curry? Today we will look at this very interesting visualisation, made by ESPN writer and FiveThirtyEight contributor Kirk Goldsberry, which documents the change in the way basketball has been played over the years.
One common trap graphics designers frequently fall into is to try and show “too much information” on a single graphic. A heuristic I like to use is that a good graphic is one that conveys exactly one piece of information, and conveys it well.
While there are examples of good graphs that contain multitudes of information, my experience has been that when presented with too much information, readers switch off. Thus, presenting the optimal amount of information, which conveys a precise message, is important in good graphics.
And this is what makes Goldsberry’s graphic so interesting.
What I love about this graph is the simplicity, and the clear message it sends out. If you are a geek (like me), an “intuitive” way to represent shot location data might be to draw a heat map. So you divide the court into areas and then look at the frequency of shots from each of those areas and colour code it as per density. While this might be a “scientific” way of showing the data, the problem is that it is hard to interpret.
For example, check out this graph made by Goldsberry himself for another article for FiveThirtyEight (I think this is also excerpted from a book that he has written). Or the heatmaps for an article in ESPN.
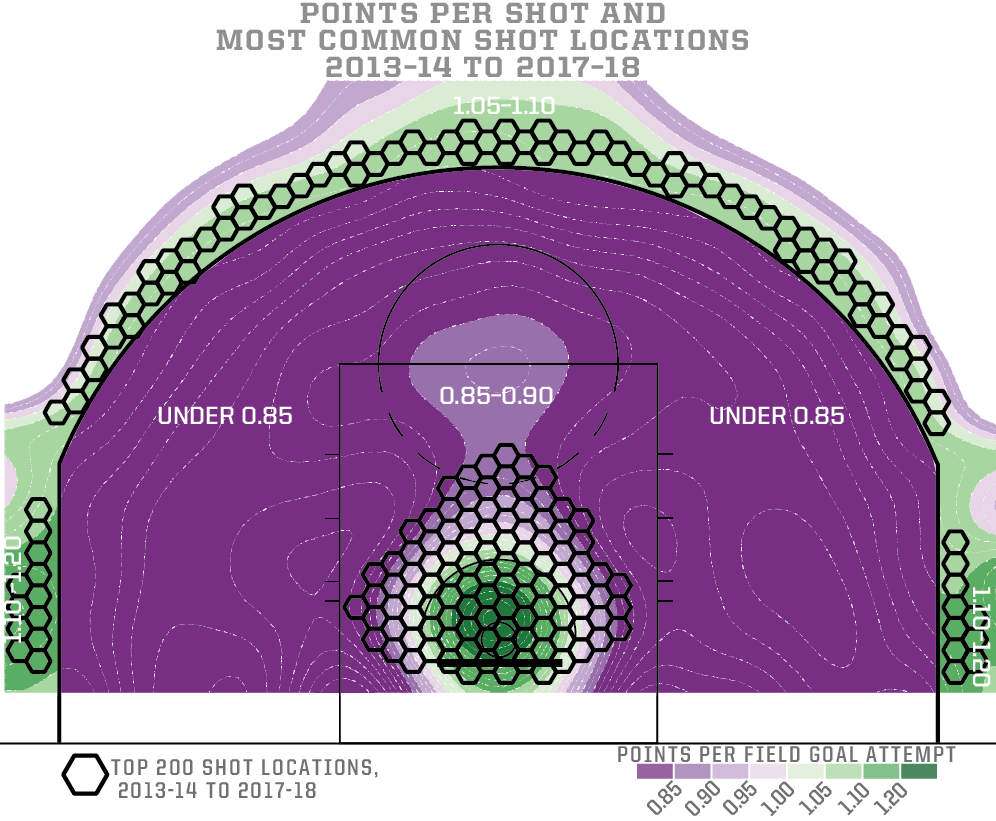
Can you interpret anything from this graph? I personally find that there is way too much information here. What’s with the greens and the purples, and all those contour lines? What are they all supposed to represent? This is exactly the kind of graph that made me come up with this rule for data stories:
Now let’s go back to the original graphic that we started with. What Goldsberry does there is to simply cut out all the noise. The information of the likelihood of making a shot from different locations, locations from which few shots are made, the exact frequency of making a shot from each location - all these are dispensed with.
Instead, he comes up with a simple (and maybe simplistic) metric - what are the top 200 locations from where NBA players took shot in the two seasons under comparison? He just plots them, adding contours for the “D” and the three-point line. And the message conveyed is extremely clear - the way NBA players take their shots has fundamentally changed over the last 20 years. The headline does an excellent job of summarising the findings (one thing in this graphic I don’t understand, and which has not been explained on the graphic, is the difference between orange and red dots).
Now, I’m not recommending this approach (‘showing top 200 locations’) for all graphics. There is surely information loss here - maybe if we had shown the top 500 locations rather than top 200, the message might have been less clear? What if we had used only 100? What is the sanctity of 200? Has it been chosen conveniently to fit the narrative?
Well, you can check out for yourself, as the raw data (nearly 5 million shots. 900MB) has been made available. And I’m sure this data can be used to tell many other stories about the evolution of the NBA (a lot of which Goldsberry seems to cover in his book, based on the two extracts I’ve read).
For example, when did the NBA evolve from a predominantly 2-pointer driven game to a combination of 3-pointers and rebounds? Ryan Soares, a student at the University of Waterloo, has taken data from pairs of years (I think he has interpreted seasons wrongly) to produce this graph, again in the spirit of Goldsberry’s limited data.
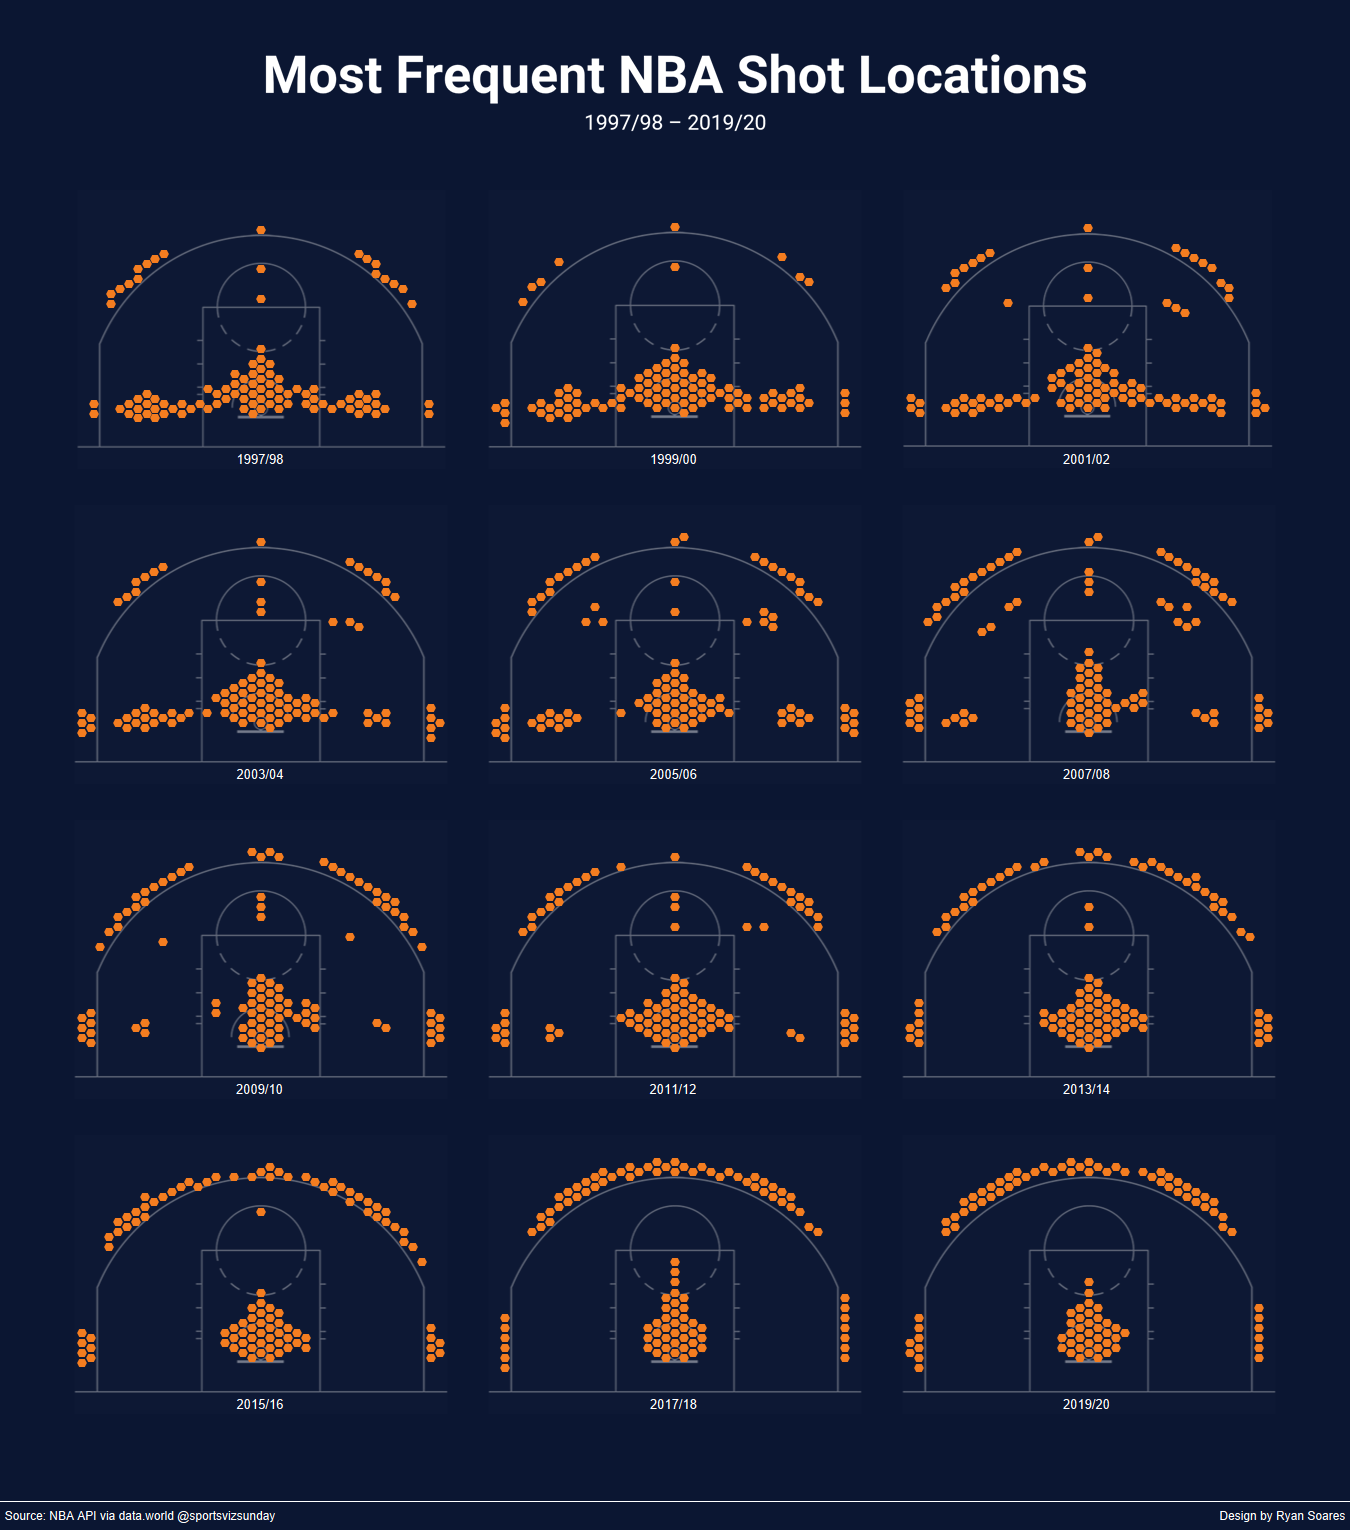
It appears like it started in 2013 or 2014 (just before the Golden State Warriors started winning), but you can see that it’s been a gradual progression over the years.
Eugene Wei, who worked in the analytics department at Amazon in its early days, has a classic (and super-long) blog post titled “remove the legend to become one”. It’s about how you need to remove the legend from a standard Excel graphic in order to make your graphic better.
In a similar spirit, I think we can say that removing data can, in may cases, actually enhance information content.